Copyright © Fred Weinhaus My scripts are available free of charge for non-commercial (non-profit) use, ONLY. For use of my scripts in commercial (for-profit) environments or non-free applications, please contact me (Fred Weinhaus) for licensing arrangements. My email address is fmw at alink dot net. If you: 1) redistribute, 2) incorporate any of these scripts into other free applications or 3) reprogram them in another scripting language, then you must contact me for permission, especially if the result might be used in a commercial or for-profit environment. Usage, whether stated or not in the script, is restricted to the above licensing arrangements. It is also subject, in a subordinate manner, to the ImageMagick license, which can be found at: http://www.imagemagick.org/script/license.php Please read the Pointers For Use on my home page to properly install and customize my scripts. |
|
Automatically thresholds an image to binary (b/w) format using Kapur's entropy technique. |
last modified: January 18, 2020
|
USAGE: kapurthresh [-g graph] infile outfile
-g ..... graph .......... graph specifies whether to generate a PURPOSE: To automatically thresholds an image to binary (b/w) format using Kapur's entropy technique. DESCRIPTION: KAPURTHRESH automatically thresholds an image to binary (b/w) format. It assume the histogram is bimodal, i.e. is the composite of two bell-shaped distributions representing the foreground and background classes. The Kapur appoach computes computes one measure of Entropy for each of the foreground (above threshold data) and background (at and below threshold value) classes. The optimal threshold is the one that maximizes the Sum of the Foreground and Background Entropies. ARGUMENTS: -g graph ... GRAPH specifies whether to generate a graph (image) of the histogram, displaying the location and value of the threshold. The choices are: view, save and none. If graph=view is selected, the graph will be created and displayed automatically, but not saved. If graph=save is selected, then the graph will be created and saved to a file using the infile name, with "_histog_kapur.gif" appended, but the graph will not be displayed automatically. If -g option is not specified, then no graph will be created. NOTE: It is highly recommended that the output not be specified as a JPG image as that will cause compression and potentially a non-binary (i.e. a graylevel) result. GIF is the recommended output format.
REFERENCES: see the following: CAVEAT: No guarantee that this script will work on all platforms, nor that trapping of inconsistent parameters is complete and foolproof. Use At Your Own Risk. |
|
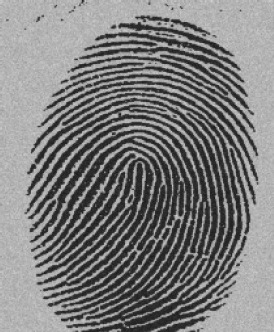
Kapur Thresholding Of Various Images |
||
|
Pictures Were Obtained from: |
||
|
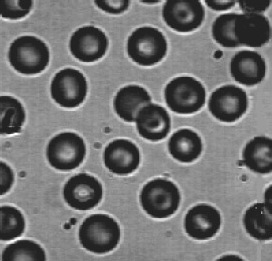
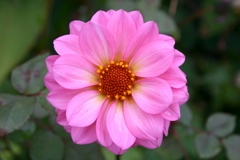
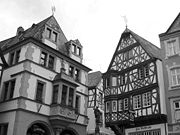
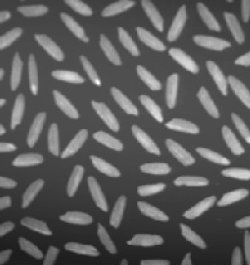
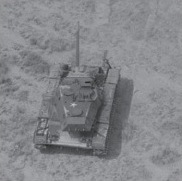
Original Image |
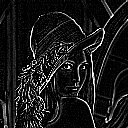
Thresholded Image |
Histogram |
|
|
|
|
|
|
|
|
|
|

|
|
|
|
|
|
|
|
|
|
|
|
|
|
|
|
|
|
|
|
|
|
|
See A Comparison Of Each Image Against Each Thresholding Technique
|
What the script does is as follows:
|