Copyright © Fred Weinhaus My scripts are available free of charge for non-commercial (non-profit) use, ONLY. For use of my scripts in commercial (for-profit) environments or non-free applications, please contact me (Fred Weinhaus) for licensing arrangements. My email address is fmw at alink dot net. If you: 1) redistribute, 2) incorporate any of these scripts into other free applications or 3) reprogram them in another scripting language, then you must contact me for permission, especially if the result might be used in a commercial or for-profit environment. Usage, whether stated or not in the script, is restricted to the above licensing arrangements. It is also subject, in a subordinate manner, to the ImageMagick license, which can be found at: http://www.imagemagick.org/script/license.php Please read the Pointers For Use on my home page to properly install and customize my scripts. |
|
Generates a piece-wise linear mapping grayscale look up table and applies it to an image |
last modified: December 15, 2018
|
USAGE: plm [-s xscale,yscale] [-c channel] [-g] "x1,y1 x2,y2 ..." infile outfile
"x1,y1 x2,y2 ..." ....... break point values of piece-wise linear transformation PURPOSE: To generate a piece-wise linear mapping grayscale look up table and applies it to an image (infile) to generate a new image (outfile). DESCRIPTION: PLM takes the supplied break point pairs and generates a one dimensional piece-wise linear grayscale look up table image that is used to change grayscale values in the channels of the input image. From 1 to 40 point pairs can be supplied either as arguments or in a text file with one pair per line supplied. The x value is the position in the look up table which is associated with the grayscale value of the desired channels of the input image and the y value is the associated grayscale value for the corresponding channels in the resulting output image. ARGUMENTS: "x1,y1 x2,y2" ... List of x,y break-points for the piece-wise linear transformation. The x,y values are non-negative break-point pairs for the piece-wise linear transformation. There is a minimum one point pair that must be supplied. The x and y values are associated with the input and output grayscale values of the look up table, where x,y values can range from 0 to xscale,yscale. xscale determines the length of the 1D lookup table (length=xscale + 1); that is, the range of x (input) values and yscale determines the range of y (output) values. Both xscale and yscale must be positive integers and their defaults are 100. If the first pair is not 0,0 or the last pair is not xscale,yscale then those points will be added automatically to the list of point pairs. IMPORTANT: the list of break-point pairs must be specified just prior to infile outfile. -f point_file ... point-file is a text file containing the list of break points, one x,y pair per line. -s xscale,yscale ... xscale,yscale is the range of values for the x,y breakpoint pairs which go from 0 to xscale,yscale; positive integers. The default is 100,100. Larger values for xscale and yscale can be used for more accuracy. For example with xscale=yscale=100, x and y values are specified between 0 and 100 and the length of the output image is 101 pixels. For xscale=yscale=255, x and y values are specified # between 0 and 255 and the length of the output image is 256. Equal values for xscale and yscale are not required. -c channel ... CHANNEL to process. Options are: red, green, blue, lightness (L from HSL), brightness (B from HSB), luma (Y from YCbCr) and luminosity (L from Lab). The default=all rgb channels. -g ... enables the creation of a graph of the piece-wise linear transformation, which is then displayed automatically. There is a default setting below that can be changed to enable this to be save to a file named outfile_graph.gif. The graph will be scaled to size 100x100. IMPORTANT: To end the script, close/quit the graph image. CAVEAT: No guarantee that this script will work on all platforms, nor that trapping of inconsistent parameters is complete and foolproof. Use At Your Own Risk. |
|
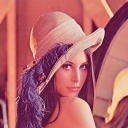
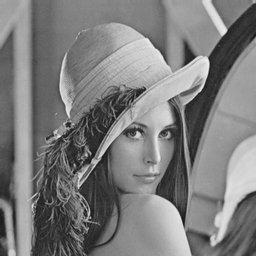
Original Color Image |
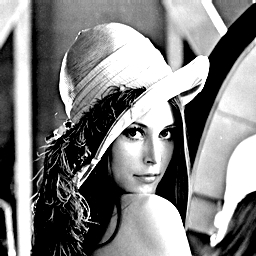
Original Grayscale Image |

|

|
|
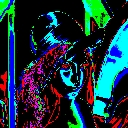
Various Piece-wise Linear (Internally Generated) LUTs Applied To Color Image |
||
|
arguments: |
arguments: |
arguments: |
|

|
|
|
|
|
|
|
|
|
|
Various Piece-wise Linear (Internally Generated) LUTs Applied To Grayscale Image |
||
|
arguments: |
arguments: |
arguments: |
|
|
|
|
|
|
|
|
|
|
|
|
Invert Values |
||||
|
Input |
PLM arguments: |
PLM Graph |
IM arguments: |
IM Command Graph |

|

|
|

|
|
|
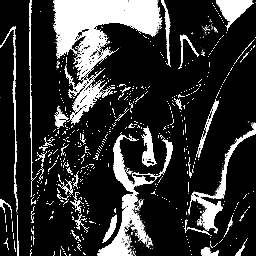
Threshold |
||||
|
Input |
PLM arguments: |
PLM Graph |
IM arguments: |
IM Command Graph |
|
|

|
|

|
|
|
Black Threshold |
||||
|
Input |
PLM arguments: |
PLM Graph |
IM arguments: |
IM Command Graph |
|
|

|
|

|

|
|
White Threshold |
||||
|
Input |
PLM arguments: |
PLM Graph |
IM arguments: |
IM Command Graph |
|
|

|
|

|
|
|
Increase Contrast |
||||
|
Input |
PLM arguments: |
PLM Graph |
IM arguments: |
IM Command Graph |
|
|

|
|

|
|
|
Decrease Contrast |
||||
|
Input |
PLM arguments: |
PLM Graph |
IM arguments: |
IM Command Graph |
|
|

|
|

|

|
|
Constant Gray |
||||
|
Input |
PLM arguments: |
PLM Graph |
IM arguments: |
IM Command Graph |
|
|

|
|

|
|
|
Clip Low |
||||
|
Input |
PLM arguments: |
PLM Graph |
IM arguments: |
IM Command Graph |
|
|

|
|

|
|
|
Clip High |
||||
|
Input |
PLM arguments: |
PLM Graph |
IM arguments: |
IM Command Graph |
|
|

|
|

|
|
|
Clip Low And High |
||||
|
Input |
PLM arguments: |
PLM Graph |
IM arguments: |
IM Command Graph |
|
|

|
|

|

|
|
Crude One Point Gamma Approximation |
||||
|
Input |
PLM arguments: |
PLM Graph |
IM arguments: |
IM Command Graph |
|
|

|

|

|
|
|
Crude Two Point Sigmoidal-Contrast Approximation |
||||
|
Input |
PLM arguments: |
PLM Graph |
IM arguments: |
IM Command Graph |
|
|

|
|

|

|
|
Ramp-Horizontal-Ramp |
||||
|
Input |
PLM arguments: |
PLM Graph |
IM arguments: |
IM Command Graph |
|
|

|
|
||
|
Ramp-Vertical-Ramp |
||||
|
Input |
PLM arguments: |
PLM Graph |
IM arguments: |
IM Command Graph |
|
|

|
|
||
|
Truncated Triangle |
||||
|
Input |
PLM arguments: |
PLM Graph |
IM arguments: |
IM Command Graph |
|
|

|
|

|
|
|
Slice |
||||
|
Input |
PLM arguments: |
PLM Graph |
IM arguments: |
IM Command Graph |
|
|

|
|

|
|
|
Sawtooth Blinds |
||||
|
Input |
PLM arguments: |
PLM Graph |
IM arguments: |
IM Command Graph |
|
|

|
|
|
|
|
What the script does is as follows:
This is equivalent to the following IM commands for the
|