Copyright © Fred Weinhaus My scripts are available free of charge for non-commercial (non-profit) use, ONLY. For use of my scripts in commercial (for-profit) environments or non-free applications, please contact me (Fred Weinhaus) for licensing arrangements. My email address is fmw at alink dot net. If you: 1) redistribute, 2) incorporate any of these scripts into other free applications or 3) reprogram them in another scripting language, then you must contact me for permission, especially if the result might be used in a commercial or for-profit environment. Usage, whether stated or not in the script, is restricted to the above licensing arrangements. It is also subject, in a subordinate manner, to the ImageMagick license, which can be found at: http://www.imagemagick.org/script/license.php Please read the Pointers For Use on my home page to properly install and customize my scripts. |
|
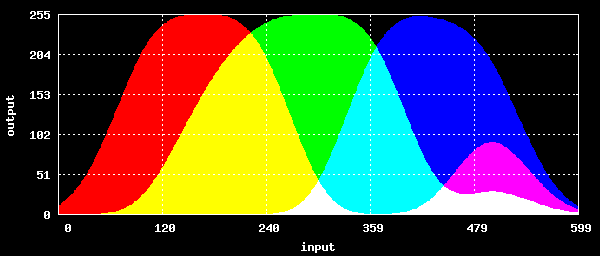
Generates a profile of an image row or column or an image histogram. |
last modified: December 15, 2018
|
USAGE: plot [-r row] [-c col] [-p process] [-m mode] [-f format] [-n normalize] [-w width] [-h height] [-t ticspace] [-d density] [-x xplotscale] [-y yplotscale] [-e expansion] [-l] [-b brightness] [-g gridmode] [-s] infile [outfile]
-r ... row .......... row of image to plot; rows start at 0; default=0 PURPOSE: To generates a profile of an image row or column or an image histogram. DESCRIPTION: PROFILE generates an output image which is composed of the separate profiles from each channel of the input image for a given row or column. Alternately the output will the histogram of each channel of the image. If the image is CMYK, then it must be converted to RGB or sRGB prior to running the script. ARGUMENTS: -r row ... ROW is the row of image to plot. Rows start at 0. The default=0. -c col ... COL is the column of image to plot. Rows start at 0. The default=0. Note, the script will use only one of -r or -c, whichever is the last one specified in the command line. The default is to use -r 0. -p process ... PROCESS is the processing type. Choices are: graph (g) or histogram (h). When mode=graph, the xplotscale and yplotscale are user specified. When mode=histogram, xplotscale=255 (8-bit data number of bins) and yplotscale is the largest count from all bins. The default=graph. -m mode ... MODE of graph/histogram. The choices are unfilled (u) or filled (f). Unfilled is simple curve. Filled is curve colored to x-axis. The default=unfilled. -f format ... FORMAT is the number of graphs. The choices are: 1 (for one combined plot) or 3 (for three separate stacked plots). When format=3, the 3 graphs will be trimmed and padded before stacking. Therefore, the width will be a litte smaller than specified and the height will be little smaller than 3x the specified height. The default=1. -n normalize ... NORMALIZE is the y-axis plot normalization. This is only useable when format=3 combined with either histogram or with graph plus yplotscale=minmax. The choices are global (g) or separate (s). The default=global. Global means to use the maximum count or maximum and minimum graylevel from r,g,b channels for normalizing the y-axis of each plot. Separate means to use each channels maximum count or maximum and minimum graylevel for normalizing its own y-axis in the corresponding plot. The default=global. -w width ... WIDTH of plot in pixels. Values are integer>=0 or "image". A value of 0 is the same as "image" (i.e. use the full length of the row or column); otherwise resize to width supplied. The default=256. -h height ... HEIGHT of plot in pixels. Values are integer>0. The default=256. -t ticspace ... TICSPACE is the tic/grid separation as a percent of the plotscales. Values are 0<integer<100. Nominal values are either 20 or 25. The default=25. -d density ... DENSITY is the thickness (strokewidth) of drawn lines. Values are either 1 or 2. The default=1. -x xplotscale ... XPLOTSCALE is the max value shown on x axes. Values are integer>0 or "image" (i.e. use the full length of the row or column). The default=image. Note this is only relevant to process=graph. For histograms, this is 255 (8-bit image depth). -y yplotscale ... YPLOTSCALE is the max value shown on y axes. The choices are integer>0 or "image" (2^depth-1; e.g. 255 for 8-bit image) or "minmax" (image channel minimum and maximum graylevel values). Typical values are either 255 (i.e. 8-bit depth) or 100 (percent). The default=image. Note this is only relevant to process=graph. For histograms, the max value comes from the histogram counts. -F font ... FONT name or path to font file and size to use. For example, "arial,9". The default=medium. -e expansion ... EXPANSION is the histogram count expandion on the graph, so that low counts can be amplified at the expense of saturating high counts. Values are floats greater than or equal to one. The default=1. -l .. use LOG base 10 plot on y (count) axis. Only for process=histogram -b brightness ... BRIGHTNESS is the background grayscale brightness. Values are 0<=integer<=100. 0 is black and 100 is white. The default=100. -g gridmode ... GRIDMODE is the grid setting. The choices are: front (f), back (b), none (n). The default=front. -s ... SHOW text list of data to terminal REQUIREMENTS: Needs GNUPLOT (4.6). I cannot guarantee it will work on older versions, but it may. Also libgd is needed by GNUPLOT for proper rendering of fonts in PNG output. The GDFONTPATH environment variable should then be set to your fonts location and that put in your PATH. The script may also work without libgd by setting the font argument to a specific font and size or to "". But that has not been tested. CAVEAT: No guarantee that this script will work on all platforms, nor that trapping of inconsistent parameters is complete and foolproof. Use At Your Own Risk. |
|
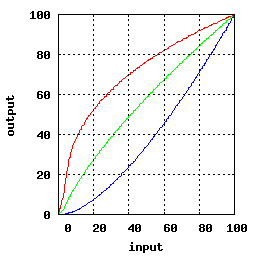
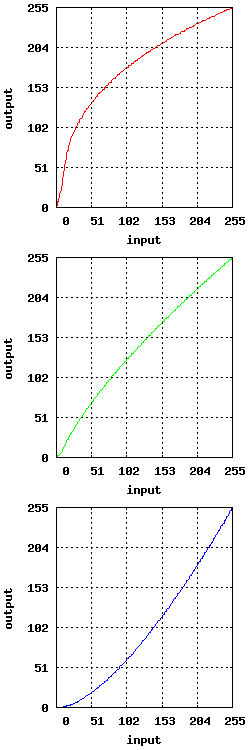
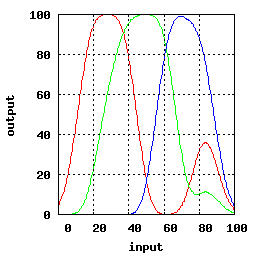
Example 1 -- Graph (Profile) |
|
Original |

|
|
Arguments: |
|
|
Arguments: |
|
|
Arguments: |
|
|
Arguments: |
|
|
Arguments: |
|
|
Arguments: |
|
|
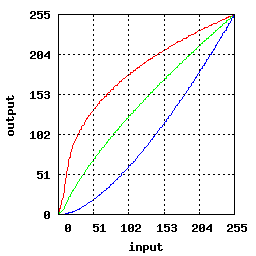
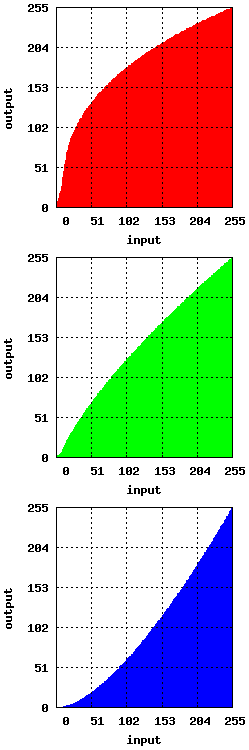
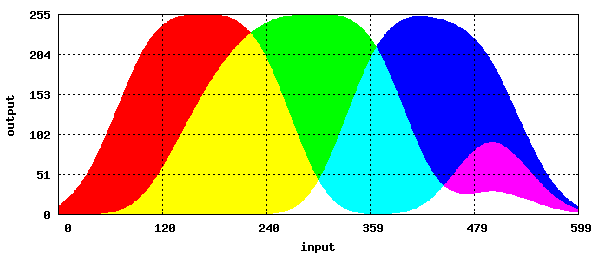
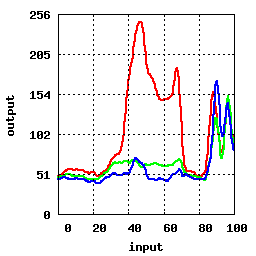
Example 2 -- Graph (Profile) |
|
Original |
|
|
|
Arguments: |
|
|
Arguments: |
|
|
Arguments: |
|
|
Arguments: |
|
|
Arguments: |
|
|
Arguments: |
|
|
Arguments: |
|
|
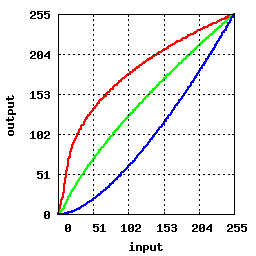
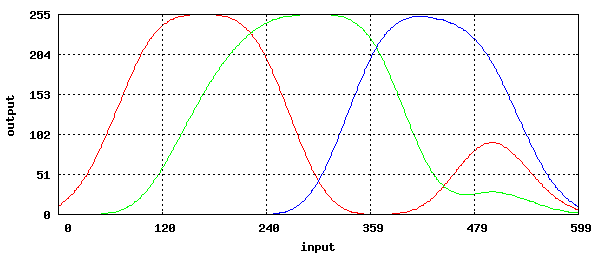
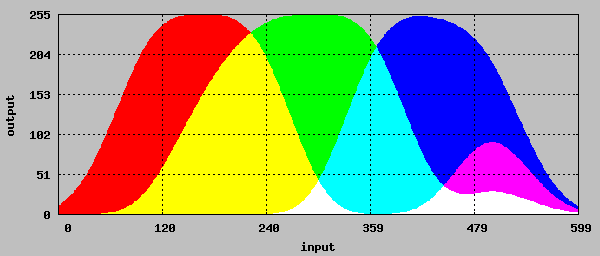
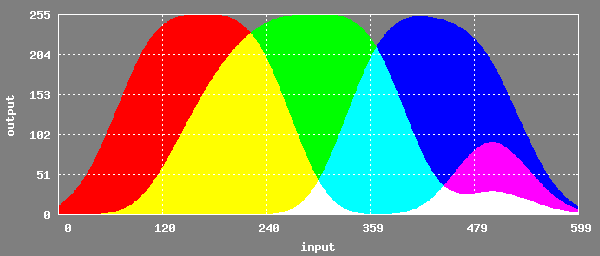
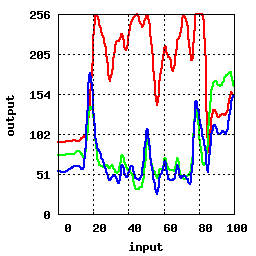
Example 3 -- Graph (Profile) |
|
Original |
|
|
|
Arguments: |
|
|
Arguments: |
|
|
Arguments: |
|
|
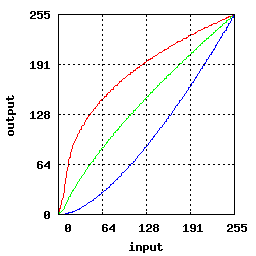
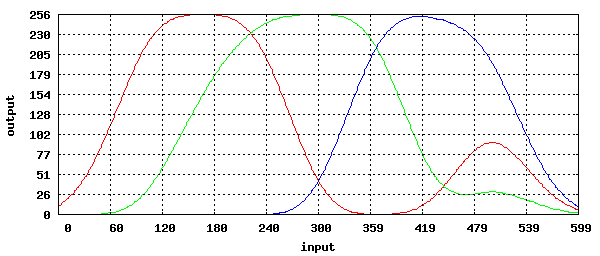
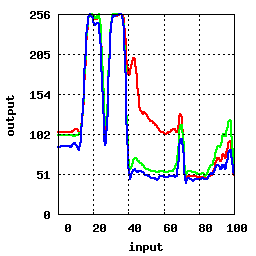
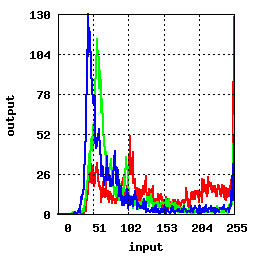
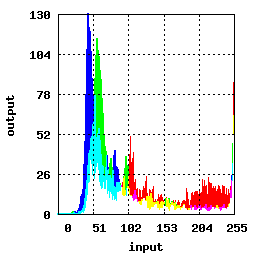
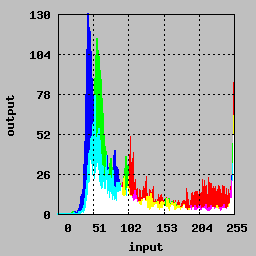
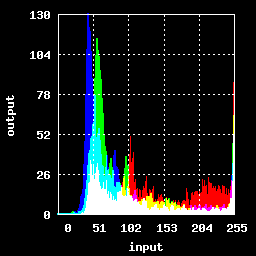
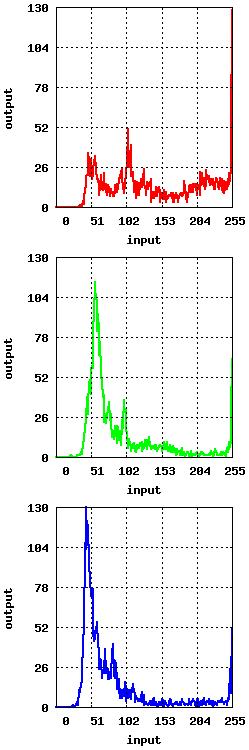
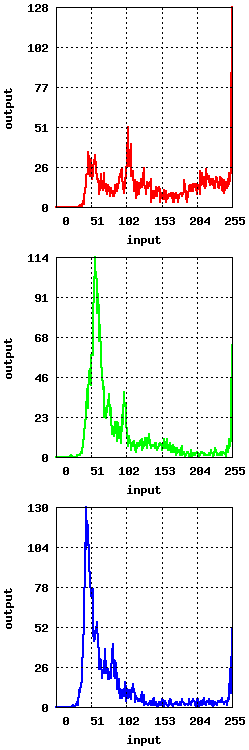
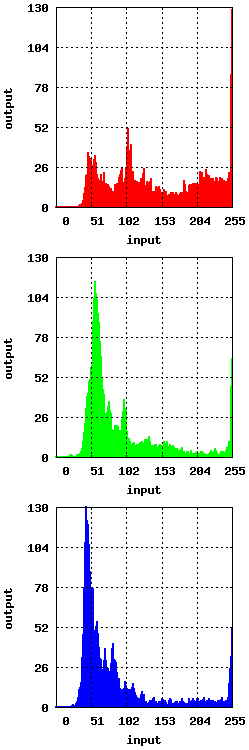
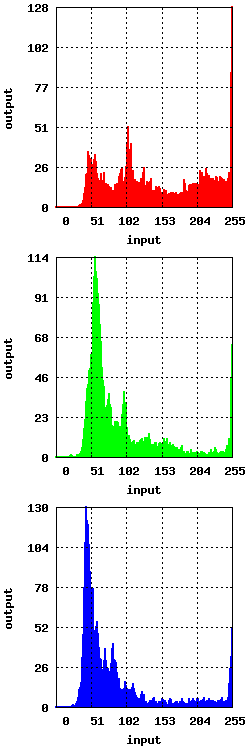
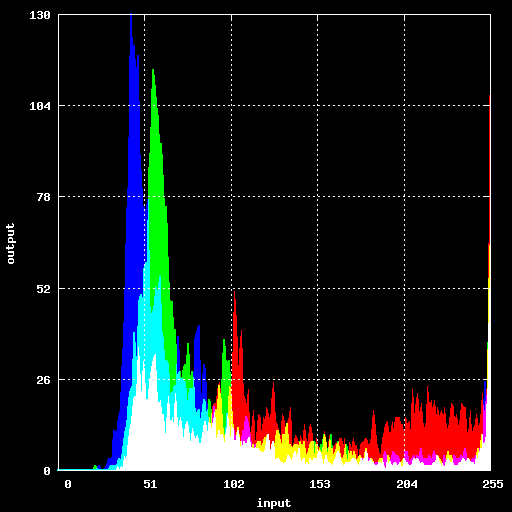
Example 4 -- Histogram |
|
Original |
|
|
|
Arguments: |
|
|
Arguments: |
|
|
Arguments: |
|
|
Arguments: |

|
|
Arguments: |

|
|
Arguments: |
|
|
Arguments: |
|
|
Arguments: |
|
|
Arguments: |
|
|
Arguments: |
|
|
Example 5 -- Histogram Enlarged |
|
Original |
|
Arguments: |
|
|
What the script does is as follows:
See the script for further details |