Copyright © Fred Weinhaus My scripts are available free of charge for non-commercial (non-profit) use, ONLY. For use of my scripts in commercial (for-profit) environments or non-free applications, please contact me (Fred Weinhaus) for licensing arrangements. My email address is fmw at alink dot net. If you: 1) redistribute, 2) incorporate any of these scripts into other free applications or 3) reprogram them in another scripting language, then you must contact me for permission, especially if the result might be used in a commercial or for-profit environment. Usage, whether stated or not in the script, is restricted to the above licensing arrangements. It is also subject, in a subordinate manner, to the ImageMagick license, which can be found at: http://www.imagemagick.org/script/license.php Please read the Pointers For Use on my home page to properly install and customize my scripts. |
|
Generates a scatter diagram between channels of an image |
last modified: December 15, 2018
|
USAGE: scatterchannels [-c channels] [-f format] [-s scale] [-l] [-t] [-m] infile
-c .... channels ..... channel pair to process; RG, GB, BR; default=all 3 pairs PURPOSE: To generate a scatter diagram between channels of an image. DESCRIPTION: SCATTERCHANNELS generates a scatter diagram between channels of an images. The 8-bit graylevel values at each corresponding pixel in the two channels are used as the x and y coordinates to plot white points on a 256x256 black background image. By default all 3 pairs of channels will be processed: red vs green, green vs blue and blue vs red. The process is slow and is proportional to the size of the input image. Therefore the image will be scaled down to the desired size in order to keep the processing to a reasonable time, but have an adequate uniform sampling of the data. The resulting graph image may be mirrored vertically so that the x,y origin is at the bottom left, if desired, rather than the default top left. ARGUMENTS: -c channels ... CHANNELS are the pair(s) of channels to be made into a a scatter diagram. The choices are: red-green or RG, green-blue or GB, blue-red or BR. The default is all 3 pairs in one image. If the image is CMYK, then RG is equivalent to CM, GB is equivalent to MY and BR is equivalent to YC. By default the first color will be along the x axis and the second color along the y axis. -f format ... OUTPUT FORMAT when channels=default (all). The format can be either 1 or 3 images. The default is 1. Output name(s) will be created from the infile and the channels. The output image will be GIF format. -s scale ... SCALE is the resulting subsampled scale size of the input image. The image will be scaled to the desired size in pixels maximum on each side, if the image is larger than this size. The default is 50. Thus for a square image equal to or larger than 50, 50x50=2500 points will be plotted. -l ... Indicates to label each axis with a color stripe of the relevant color when channels is not default (all) or when format=3. In other words, when separate channel-to-channel scatter images are created. -t ... Indicates to transpose the resulting scatter diagram, interchanging the x and y axes (colors/channels). -m ... Indicates to mirror the resulting scatter diagram vertically, so that the x,y origin is at the bottom left rather than the top left. NOTE: This process is slow and takes about 2 minutes to generate with the default sample size of 50 on my Mac Mini 1.4 GHz G4. CAVEAT: No guarantee that this script will work on all platforms, nor that trapping of inconsistent parameters is complete and foolproof. Use At Your Own Risk. |
|
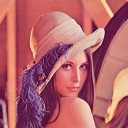
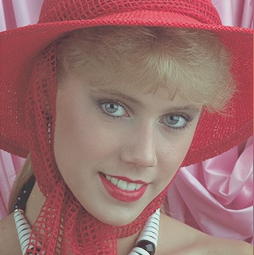
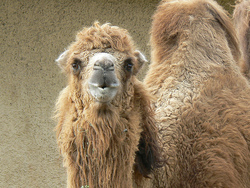
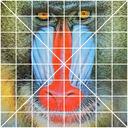
One Color Scatter Image |
|
|
Image |
Scatter Diagram |
|
|
|
Image |
Scatter Diagram |
|
|
|
Image |
Scatter Diagram |
|
|
|
Image |
Scatter Diagram |
|
|
|
Image |
Scatter Diagram |

|
|
|
Three Grayscale Channel To Channel Scatter Images -- Variation In Orientation |
|||
|
Image |
Red-Green Scatter Diagram |
Green-Blue Scatter Diagram |
Blue-Red Scatter Diagram |
|
|
|
|
|
|
Image |
Red-Green Scatter Diagram |
Green-Blue Scatter Diagram |
Blue-Red Scatter Diagram |
|
|
|
|
|
|
What the script does is as follows:
This is equivalent to the following IM commands.
|