Copyright © Fred Weinhaus My scripts are available free of charge for non-commercial (non-profit) use, ONLY. For use of my scripts in commercial (for-profit) environments or non-free applications, please contact me (Fred Weinhaus) for licensing arrangements. My email address is fmw at alink dot net. If you: 1) redistribute, 2) incorporate any of these scripts into other free applications or 3) reprogram them in another scripting language, then you must contact me for permission, especially if the result might be used in a commercial or for-profit environment. Usage, whether stated or not in the script, is restricted to the above licensing arrangements. It is also subject, in a subordinate manner, to the ImageMagick license, which can be found at: http://www.imagemagick.org/script/license.php Please read the Pointers For Use on my home page to properly install and customize my scripts. |
|
Modifies an image so that its (grayscale) histogram has either a Gaussian or Uniform distribution |
last modified: December 19, 2022
|
USAGE: redist [-s shape] [-m colormodel] [-c channel] [-g graytype]
[-f factor] [-G] [-L] [mean[,lo[,hi]]] infile outfile
-s . shape ....... redistribution shape - choice of Gaussian or Uniform; PURPOSE: To modify an image so that its (grayscale) histogram has either a Gaussian (sometimes called normal or bell-shaped) distribution or a Uniform (constant height) distribution. The latter is equivalent to histogram equalization. DESCRIPTION: REDIST is designed to apply an intensity mapping transformation to an image such that the resulting image's grayscale histogram has a specified distribution shape (Gaussian or Uniform). For colormodel not equal to RGB, it first converts the image to that color space via the colormodel parameter and processes the intensity-like channel. For colormodel=RGB, it converts the image to an appropriate intensity-like channel as specified by graytype. Either way it computes the intensity-like channel's cumulative histogram. The script then generates the integral of the specified distribution scaled to the last value in the cumulative histogram. For each value in the image's cumulative histogram, it finds the closest value in the integral and then looks to see what its graylevel value is. It uses those graylevel values as the y-value in a mapping transformation whose x-values range from 0-255. This mapping transformation is expressed as a 1-D image and used with the IM function -fx or -clut to transform the input image. For colormodel not RGB, it process only the intensity-like channel and then recombines the channels and converts back to RGB. For colormodel RGB, it applies the transformation to each channel of the RGB image. If a graph is desired, it is normally just viewed. However, a default parameter in the program can be set to allow it to be saved as outfilename_graph.gif. To end the script, close/quit the graph image. ARGUMENTS: -h or -help ....... displays help information. -s SHAPE defines the desired distribution shape, which can be either Gaussian (also known as normal or bell-shaped) or Uniform (constant height). The default is Gaussian if -s shape is not specified. -m COLORMODEL defines the color model to use for the processing of an RGB color image into a grayscale image in order to compute the required cumulative histogram. If a colormodel other than RGB or GLOBAL is specified, then the image is first transformed into that color space and an intensity-like channel will then be used to compute the cumulative histogram. If RGB is selected, the RGB image is converted to an appropriate grayscale according to the graytype. This grayscale image is then used to generate the cumulative histogram. If GLOBAL is selected, then the combined cumulative histogram from all the channels is computed. The default value is RGB when colormodel is not provided. Note that results vary between the different color models. -c CHANNEL defines which channel to use for the histogram processing. Values for channel may be 0, 1 or 2, which correspond to those generated by the conversion to that color space. For RGB, this is R=0, G=1, B=2. For HSL, this is H=0, S=1, L=2. The same goes for the other color spaces. This will override the default value which is set for most colorspaces to the most intensity-like channel. For HSL and HSB, this is channel 2. For all others except RGB and GLOBAL, this is channel 0. For GLOBAL, all channels will be combined to compute the histogram. -g GRAYTYPE defines the type of grayscale image to use when colormodel=RGB. The choices are: gray (same as rec609luma; YUV, YIQ, YCbCr channel 1; HCL channel 2), rec709 (which is rec709luma), lightness (from HSL channel 2), brightness (from HSB channel 2), ave (from OHTA channel 1), luminance (from LAB channel 1), demodhsl (demodulate in HSL colorspace) and demodhcl (demodulate in CHCL colorspace). The default=gray. Note that gray is the same as rec601luma prior to IM 6.8.5.5 and is the same as rec709luma for IM 6.8.5.5 forward. -f factor ... FACTOR is the contrast gain limiting factor. Smaller values will limit contrast gain more; values above about 3 will produce no contrast limit. Values are floats>=0. The default is no contrast gain limitation. The factor is used to combine the histogram count mean and standard deviation to compute a maximum threshold for the histogram counts in order to limit the contrast. The threshold=countmean+factor*countstd. -G ... displays graph of intensity mapping function. -L ... Save the lookup table image. If saved, it will be named redist_lut.png MEAN is the desired center point for the peak in the Gaussian distribution. It is an integer in the range of 0 to 100 (graylevel %). Its default value is 60. LO is the desired 1 sigma roll-off point on the low side of the distribution, expressed as pixels from the peak. This is where the Gaussian shape has dropped to 61% of its maximum value. The range between the peak and this point, will contain 34% of all the pixels in the image. It is an integer which is greater than zero. Its default is 60. HI is the desired 1 sigma roll-off point on the high side of the distribution, expressed as pixels from the peak. This is where the Gaussian shape has dropped to 61% of its maximum value. The range between the peak and this point, will contain 34% of all the pixels in the image. It is an integer which is greater than zero. Its default is 60. If LO is provided, but not HI, then HI will be set equal to LO. REQUIRES: NetPBM PGM format intermediate image. See http://netpbm.sourceforge.net/ NOTE: Thanks to Anthony Thyssen for the suggested changes from shell calculations for the histograms to the use of AWK. This has produced a 10x performance speed up. NOTE: Thanks to Alan Gibson (user snibgo) for the techniques to limit contrast gain by capping any histogram bin count above a threshold. CAVEAT: No guarantee that this script will work on all platforms, nor that trapping of inconsistent parameters is complete and foolproof. Use At Your Own Risk. |
(All Histograms From Other Approaches Were Generated From The Lightness Channel)
|
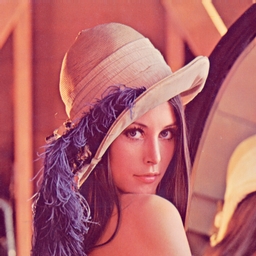
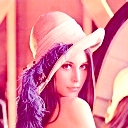
Lena Image |
||||
|
Original Image |
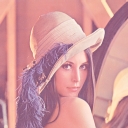
Artificially brightened |
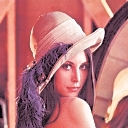
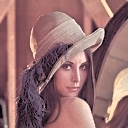
arguments: |
arguments: |
arguments: |
|
|
|
|
|
|
|
|
|
|
|
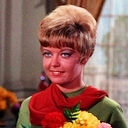
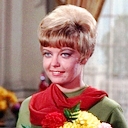
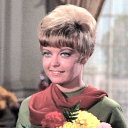
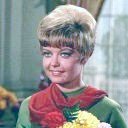
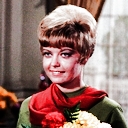
Zelda Image |
||||
|
Original Image |
arguments: |
arguments: |
arguments: |
arguments: |
|
|
|
|
|
|
|
|
|
|
|
Zelda Image Comparison To Other Systems' Autolevels |
||||
|
Original Image |
arguments: |
Photoshop |
GraphicConverter |
GIMP |
|
|
|
|

|
|
|
|
|
|
|
|
|
Zelda Image Comparison To Other ImageMagick Options |
||||
|
Original Image |
arguments: |
ImageMagick |
ImageMagick |
ImageMagick |
|
|
|
|
|
|
|
|
|
|
|
|
|
Zelda Image Comparison To Fred's Omnistretch Script |
||||
|
Original Image |
arguments: |
omnistretch |
omnistretch |
omnistretch |
|
|
|
|
|
|
|
|
|
|
|
|
|
Zelda Image Parameter Variations |
|||
|
Original Image |
arguments: |
arguments: |
arguments: |
|
|
|
|
|
|
|
|

|
|
|
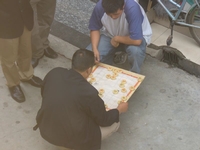
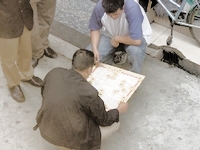
Chinese Checkers Image Parameter Variations |
||
|
Original Image |
arguments: |
arguments: |
|
|
|
|
|
|
|
Zelda - All Three Channels Modified Successively |
||
|
Original Image |
arguments: |
|
|
|
|
|
|
|
|
|
Zelda Image |
|||
|
Original Image |
arguments: |
arguments: |
ImageMagick -equalize |
|
|
|
|
|
|
|
|
|
|
|
COMMENT: Some ImageMagick, Photoshop and other applications process each channel of the image separately; whereas, redist uses a common histogram to process all channels of the image, thereby keeping the colors in sync. |
|
What the script does is as follows for the case of Gaussian shape and HSL colormodel:
This is equivalent to the following IM commands:
|