Copyright © Fred Weinhaus My scripts are available free of charge for non-commercial (non-profit) use, ONLY. For use of my scripts in commercial (for-profit) environments or non-free applications, please contact me (Fred Weinhaus) for licensing arrangements. My email address is fmw at alink dot net. If you: 1) redistribute, 2) incorporate any of these scripts into other free applications or 3) reprogram them in another scripting language, then you must contact me for permission, especially if the result might be used in a commercial or for-profit environment. Usage, whether stated or not in the script, is restricted to the above licensing arrangements. It is also subject, in a subordinate manner, to the ImageMagick license, which can be found at: http://www.imagemagick.org/script/license.php Please read the Pointers For Use on my home page to properly install and customize my scripts. |
|
Generates a 3D plot of a single channel or grayscale image. |
last modified: December 10, 2023
|
USAGE: plot3D [-w width] [-h height] [-c channel] [-a autolevel] [-ti title]
[-f format] [-s skip] [-pn pan] [-tl tilt] [-xy xyplane] [-b box] [-tc tics]
[-lb label] [-g grid] [-k key] [-xs xscale] [-ys yscale] [-xo xoffset]
[-yo yoffset] [-z zlog] [-lc linecolor] [-p palettefile] infile [outfile]
-w ... width .......... width of output image; default=500 PURPOSE: To generate a 3D plot of a single channel or grayscale image. DESCRIPTION: PLOT3D generates a 3D plot of a single channel or grayscale image. The plot will be in pseudocolor or line format. A color image may be used to see each channel plotted on the same graph. ARGUMENTS: -w width ... WIDTH of output image. The default=500. -h height ... HEIGHT of output image: The default=500. -c channnel ... CHANNEL of input image to use. The options are: red, green, blue, alpha, cyan, magenta, yellow, black, gray, color. (gray is image converted to grayscale). (color is full color image; format=1,5 only). The default=gray. -a autolevel ... AUTOLEVEL is used to apply -auto-level to the input image. Choices are on or off. The default=off. -ti title ... TITLE to use for the graph. The default is no title. -f format ... FORMAT (type) of graph to create. The choices are: 1 (pseudocolor), 2 (pseudocolor with image at bottom), 3 (pseudocolor with contours at top), 4 (pseudocolor with lines overlaid), 5 (lines only). The default=1. -s skip ... SKIP is the pixel skip amount for format=4 and 5. Values are integer>0. The default=3.
-pn pan ... PAN angle for the plot. Clockwise rotation. Values are
0
-tl tilt ... TILT angle for plot. 0 is face on to the image, i.e.,
looking down the z axis. 90 is the z axis in the plane of the output image.
Values are 0
-xy xyplane ... XYPLANE is the location of xy axes (and grid with tics and
lines). Choices are: top or bottom. The default=top.
-b box ... BOX around graph. Choices are: full, axes (only), none.
The default=full.
-tc tics ... show TICS. Choices are: on or off. The default=on.
-lb label ... show x,y,z axes LABELs. Choices are on or off. The default=on.
-g grid ... show GRID lines. Choices are xy, back, off. xy is only on the
on the xy plane, back is also the back faces. The default=xy.
-k key ... show palette color KEY. Choices are: on or off. The default=on.
-p palettefile ... PALETTEFILE is the colorizing palette. Choices are RGB1,
RGB2, gray user supplied text file listing the r,g,b colors. The default=RGB1.
RGB1 colors (black, dark-violet, blue, cyan, green, yellow, orange, red).
RGB2 colors (red, yellow, green, cyan, blue, magenta). The text file should
be either 3 or 4 space delimited values in the range 0-255 (or 0 to 1) with
one set per row. The first column can be left off if equal spacing of the
colors is desired. It can also be simply a range from 0 incremented by 1 for
equal spacing of the colors. Otherwise, the first column is the intensity
level where each color should show in the palette.
-lc linecolor ... LINECOLOR is the overlay line color for format=4. Values
may be gnuplot colornames or hex values. The default=white.
-xs xscale ... XSCALE is the scaling factor for the graph in the horizontal
output dimension. Value are floats>0. The default=1.
-ys yscale ... YSCALE is the scaling factor for the graph in the vertical
output dimension. Values are floats>0. The default=1.
-xo xoffset ... XOFFSET is the offset for the graph in the horizontal output
dimension. Value may be positive (up), zero, or negative (down) floats.
The default=0.
-yo yoffset ... YOFFSET is the offset for the graph in the vertical output
dimension. Values may be positive (up), zero, or negative (down) floats.
The default=0.
-z zlog ... ZLOG is used to apply log scaling to z (intensity) data. Choices
are: on or off. The default=off. This argument is only valid for format=1,4,5.
REQUIREMENTS: Needs GNUPLOT (4.6). I cannot guarantee it will work on older
versions, but it may. Also libgd may be needed by GNUPLOT for proper rendering
of fonts in PNG output.
CAVEAT: No guarantee that this script will work on all platforms,
nor that trapping of inconsistent parameters is complete and
foolproof. Use At Your Own Risk.
|
|
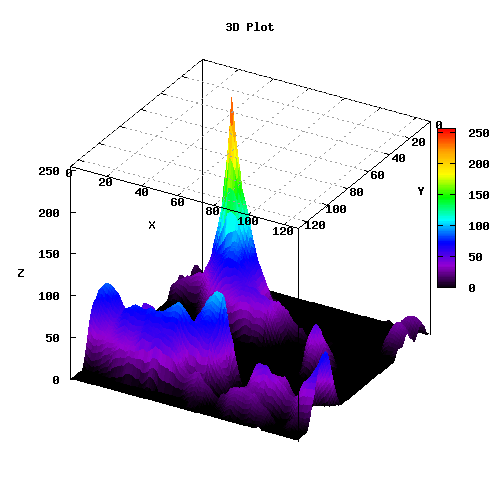
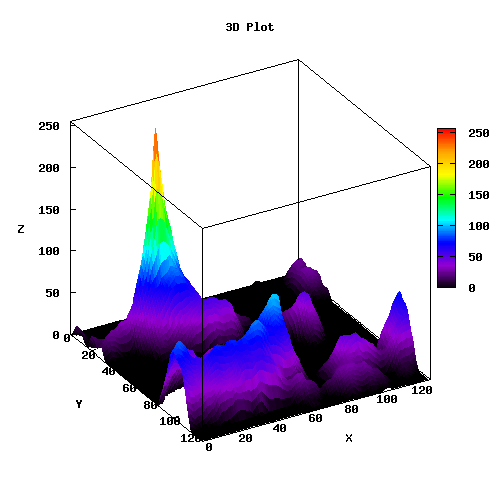
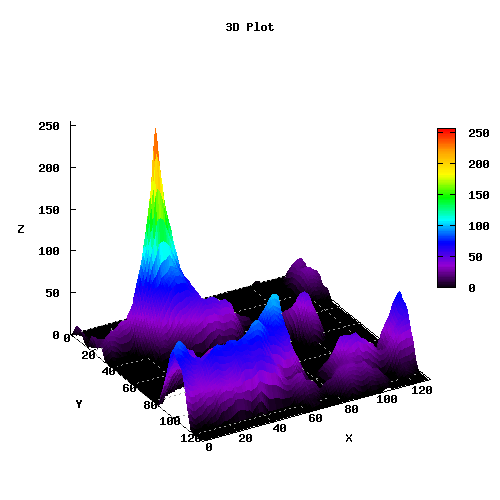
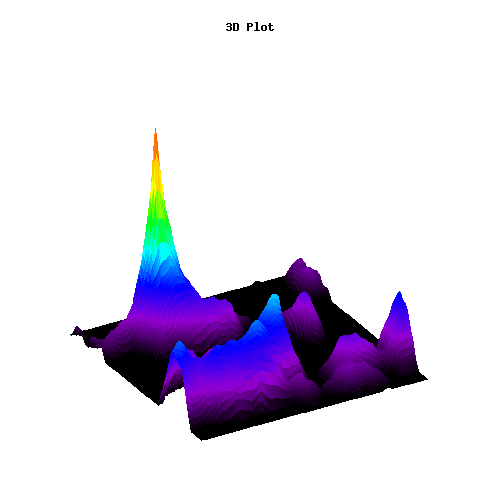
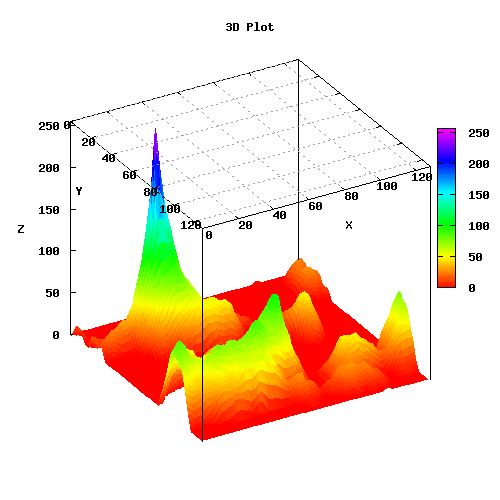
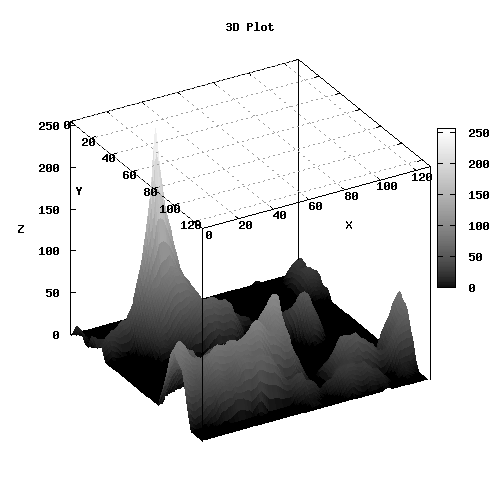
Example 1 -- Variations of Format=1 (Grayscale) |
||
|
Original |
||
|
||
|
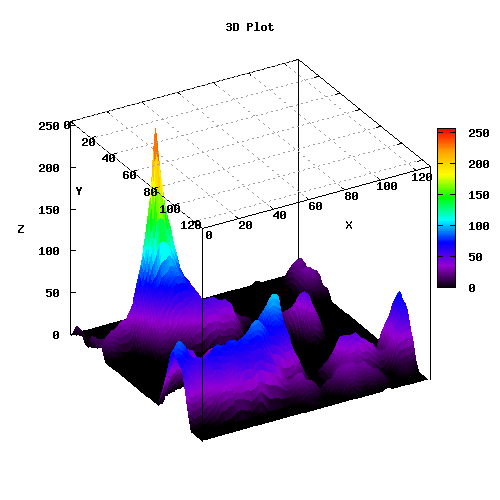
Arguments: |
||
|
||
|
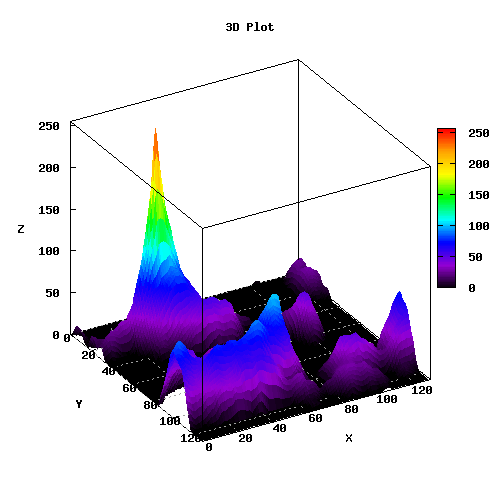
Arguments: |
||
|
||
|
Arguments: |
||
|
||
|
Arguments: |
||

|
||
|
Arguments: |
||
|
||
|
Arguments: |
||
|
||
|
Arguments: |
||
|
||
|
Arguments: |
||
|
||
|
Arguments: |
||
|
||
|
Arguments: |
||
|
Palette Files (all produces the same results) | ||
|
0 0 0 |
0 0 0 0 |
0 0 0 0 |
|
||
|
Arguments: |
||
|
||
|
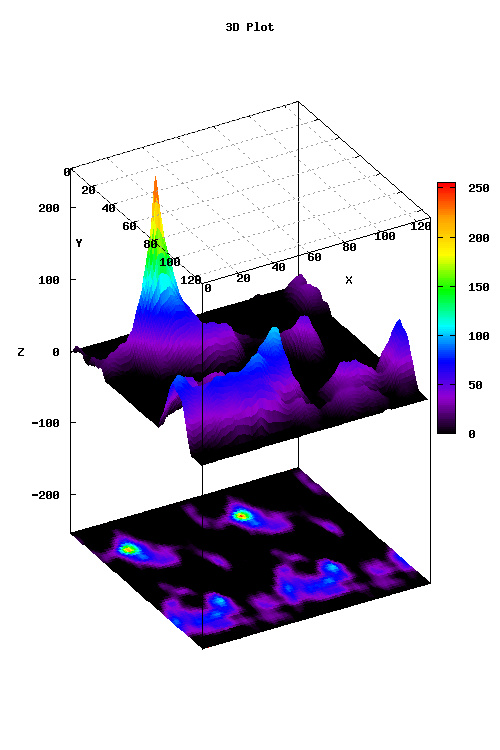
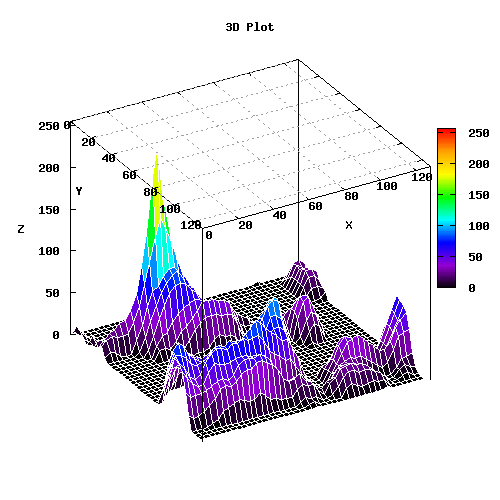
Example 2 -- Format=2 (Grayscale) |
|
Original |
|
|
|
Arguments: |
|
|
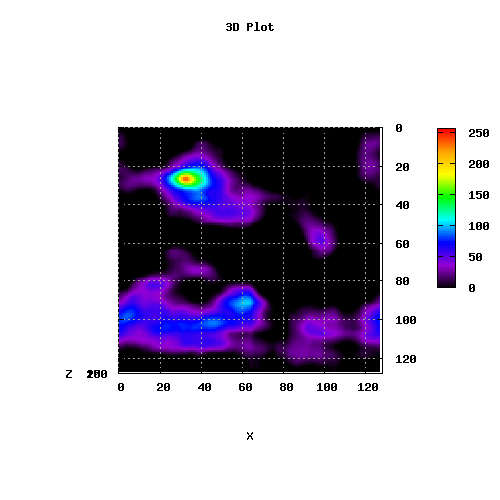
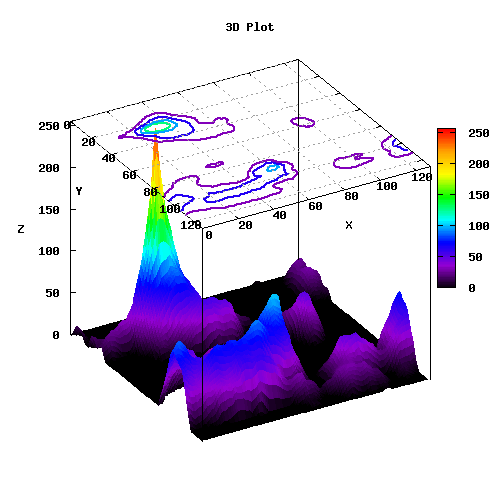
Example 3 -- Format=3 (Grayscale) |
|
Original |
|
|
|
Arguments: |
|
|
Example 4 -- Format=4 (Grayscale) |
|
Original |
|
See List of Acceptable Colornames at |
|
|
|
Arguments: |
|
|
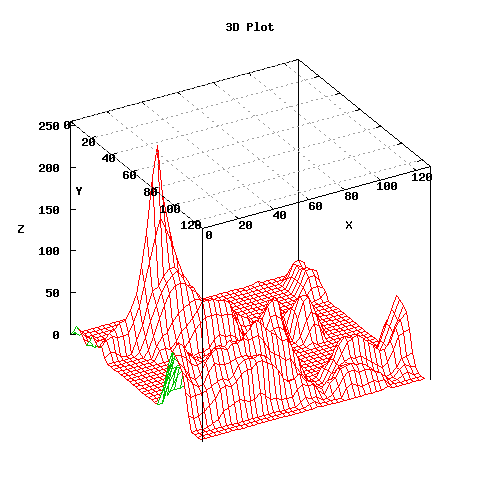
Example 5 -- Format=5 (Grayscale) |
|
Original |
|
|
|
Arguments: |
|
|
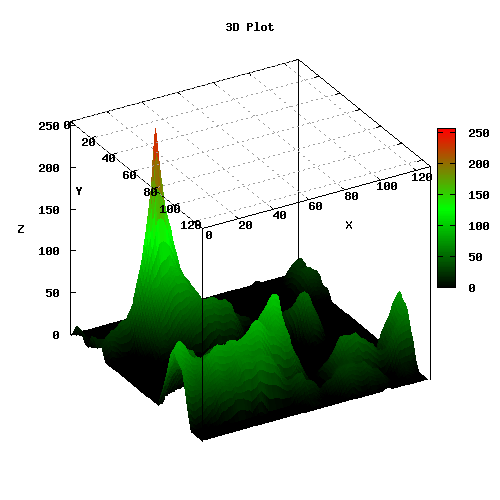
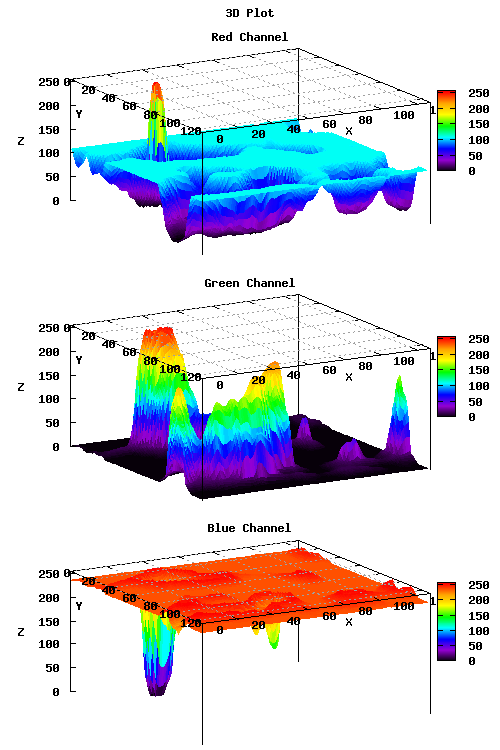
Example 6 -- Format=1 (Color) |
|
Original |
|
|
Arguments: |
|
|
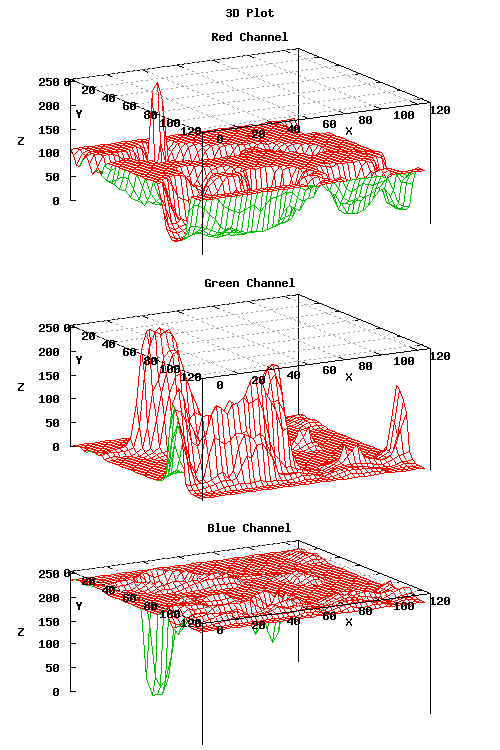
Example 7 -- Format=5 (Color) |
|
Original |
|
|
|
Arguments: |
|
|
What the script does is as follows:
See the script for further details |