Copyright © Fred Weinhaus My scripts are available free of charge for non-commercial (non-profit) use, ONLY. For use of my scripts in commercial (for-profit) environments or non-free applications, please contact me (Fred Weinhaus) for licensing arrangements. My email address is fmw at alink dot net. If you: 1) redistribute, 2) incorporate any of these scripts into other free applications or 3) reprogram them in another scripting language, then you must contact me for permission, especially if the result might be used in a commercial or for-profit environment. Usage, whether stated or not in the script, is restricted to the above licensing arrangements. It is also subject, in a subordinate manner, to the ImageMagick license, which can be found at: http://www.imagemagick.org/script/license.php Please read the Pointers For Use on my home page to properly install and customize my scripts. |
|
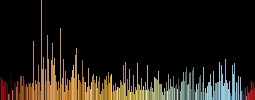
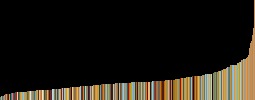
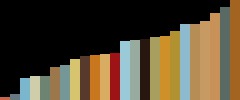
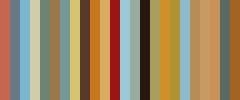
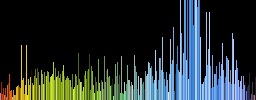
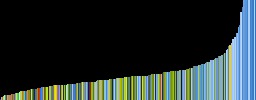
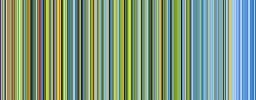
Creates either a spectrum or histogram of the colors in an image. |
last modified: November 10, 2023
|
USAGE: spectrumhist [-t type] [-s sort] [-w width] [-h height] [-m magnify] [-c colors] infile outfile
-t ... type ...... type of output; histogram (h) or spectrum (s); PURPOSE: To create either a spectrum or histogram of the colors in an image. DESCRIPTION: SPECTRUMHIST creates either a color spectrum or histogram of the colors in an image. This is a bar graph of the exact colors rather than a histogram by channels. The graph may be sorted either by count or by hue. ARGUMENTS: -t type ... TYPE of output. Choices are histogram (h) or spectrum (s). The default=histogram -s sort ... SORT is the mode of sorting the colors. The choices are: count (c), hue (h), sat (s) for saturation, lum (l) for luminosity (i.e. intensity), rgb (r) or bgr (b). The default=hue -w width ... WIDTH of the bars in the bar chart. Values are integers>0. The default=1 -h height ... HEIGHT of the output image. Values are integer>0. The default=100 -m magnify ... MAGNIFY is the magnification factor for count scaling. This scales the height of each bar of the histogram, but does not affect the height of the image. Any bar that is taller than the image will be clipped. This is not relevant to type=spectrum. Values are integers>0. The default=1 -c colors ... COLORS is the number of colors desired for color reduction in the input image. Values are 0<integer<=256. The default=256. If the image has fewer colors than selected, the actual number of colors will be used. -b bgcolor ... BGCOLOR is the background color. Any valid IM color is allowed. The default=black CAVEAT: No guarantee that this script will work on all platforms, nor that trapping of inconsistent parameters is complete and foolproof. Use At Your Own Risk. |
|
Example 1 |
|
|
Original |
|
|
|
|
|
Arguments: |
Arguments: |

|

|
|
Arguments: |
Arguments: |

|

|
|
Example 2 |
|
|
Original |
|
|
|
|
Arguments: |
Arguments: |
|
|
|
Arguments: |
Arguments: |

|

|
|
Arguments: |
Arguments: |

|
|
|
Arguments: |
Arguments: |

|
|
|
Example 3 |
|
|
Original |
|
|
|
|
Arguments: |
Arguments: |
|
|
|
Arguments: |
Arguments: |

|
|
|
Arguments: |
Arguments: |

|

|
|
Arguments: |
Arguments: |

|

|
|
Example 4 |
|
|
Original |
|
|
|
|
|
Arguments: |
Arguments: |
|
|
|
|
Arguments: |
Arguments: |
|
|
|
|
Arguments: |
Arguments: |
|
|
|
|
Arguments: |
Arguments: |
|
|
|
|
Example 5 -- Spectrum vs Sort |
|
Original |
|
|
|
Arguments: |
|
|
Arguments: |
|
|
Arguments: |
|
|
Arguments: |
|
|
Arguments: |
|
|
Arguments: |
|
|
Example 6 -- Spectrum vs Sort |
|
Original |
|
|
|
Arguments: |
|
|
|
Arguments: |
|
|
|
Arguments: |
|
|
|
Arguments: |
|
|
|
Arguments: |
|
|
|
Arguments: |
|
|
|
What the script does is as follows for the case of type=histogram and sort=hue:
This is equivalent to the following IM commands
|